XRHUB Analytics Explained: The Metrics That Prove Your XR Program's ROI
Prove your XR program ROI with the right metrics. Discover what XRHUB Analytics tracks to help justify and scale your initiative.
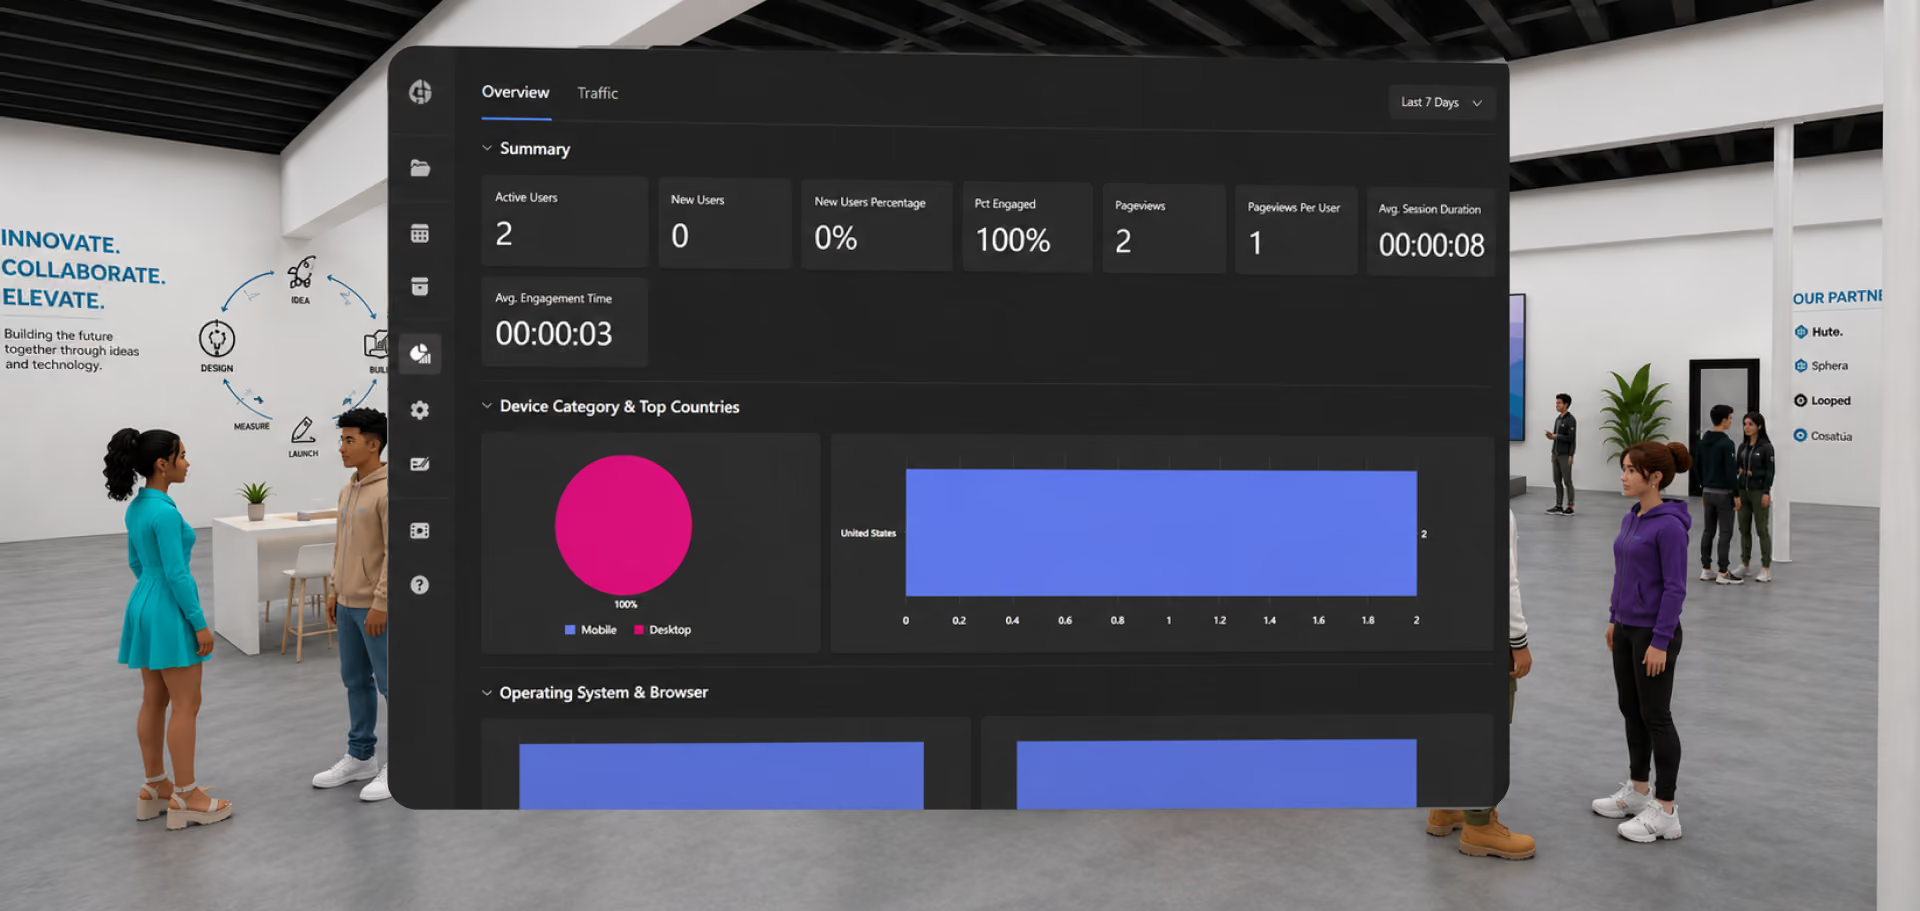
XR program ROI is proven with engagement and outcome data — active users, session duration, engagement time, completion rates, and traffic sources — captured automatically by the platform hosting the environment. XRHUB Analytics tracks these metrics per environment, giving program owners the reporting data that would otherwise require a separate analytics build.
This matters more than it sounds: the biggest threat to a first XR program usually isn't the pilot itself — it's the second budget cycle, when someone asks "did it work?" and the answer needs to be a number, not an impression.
The core metrics that actually matter
Not every metric earns a place in a leadership report. The ones that consistently do:
- Active & new users — reach, and whether it's growing or one-time
- Session duration & engagement time — the difference between someone opening a link and someone actually spending time inside it
- Top events — what people actually did inside the environment (which booth, which module, which room)
- Traffic sources — which channel drove people to the experience, critical for campaign attribution
- Completion rate (training-specific) — the metric L&D and compliance stakeholders ask for first
Turning metrics into a program case, not just a dashboard
Raw numbers convince no one on their own. The pattern that works: pair one engagement metric with one business outcome per report cycle — "average session duration of 11 minutes, compared to a 90-second average video completion rate," or "42% booth-to-booth traffic increase versus last quarter's static webinar page." The comparison, not the raw number, is what gets a program renewed.
Common questions about XR analytics
- What analytics does XRHUB track? XRHUB tracks active users, new users, pageviews, session duration, engagement time, traffic sources, and top events per environment — automatically, without a separate analytics integration, for every Verse published on the platform
- Can XR analytics prove training ROI specifically? Yes, when paired with completion tracking. Session duration and engagement time show whether trainees actually worked through content, while completion rate ties the environment back to the compliance or skills metric L&D programs are usually measured against.
- How is XR analytics different from website analytics? Website analytics measure page views and clicks on flat content. XR analytics measure behavior inside a 3D space — which room someone entered, how long they lingered, which object they interacted with — data with no equivalent on a traditional webpage.
- Can sponsors or stakeholders see analytics for their specific area? Per-environment and per-zone tracking (a specific booth, a specific training module) means reporting can be scoped to exactly what a sponsor or stakeholder cares about, without exposing unrelated program data.
- Do we need a separate analytics tool alongside an XR platform? Not for core engagement metrics — that data should be native to the platform. A separate tool becomes relevant only for advanced cross-channel attribution beyond what platform-native analytics cover.
Related reading
See how this works on our virtual event platform page. You may also like What Is Metaverse as a Service (MaaS)? and Inside a 150-Person Browser-Native AI Summit: A Virtual Conference Case Study.
Get started
See your program's data model before you build. Get a Demo or Build for Free